Writing a Helm chart for an Angular Application at my Org
Last week we had an internal hackathon at our org. We were told to find some interesting projects or solve some existing problems. After some discussion, we found around few points like :-
- Getting rid of Luigui and having our micro-frontend framework
- Genrating lighthouse report dynamically
- Integrating storybook
- Reducing dependencies from the backend side for the client
- Creating a mock server that helps at org level to pick the data from redocly
All of these ideas were cool enough, but during the time I didn’t had the feeling of doing any core frontend related work. I tried thinking of different ideas and found the idea of writing a Helm chart for our micro-frontends enough to keep me intrigued.
First lets start by creating a ‘Hello World’ level of angular application
$ ng new hello-world
$ cd hello-world
$ ng serve
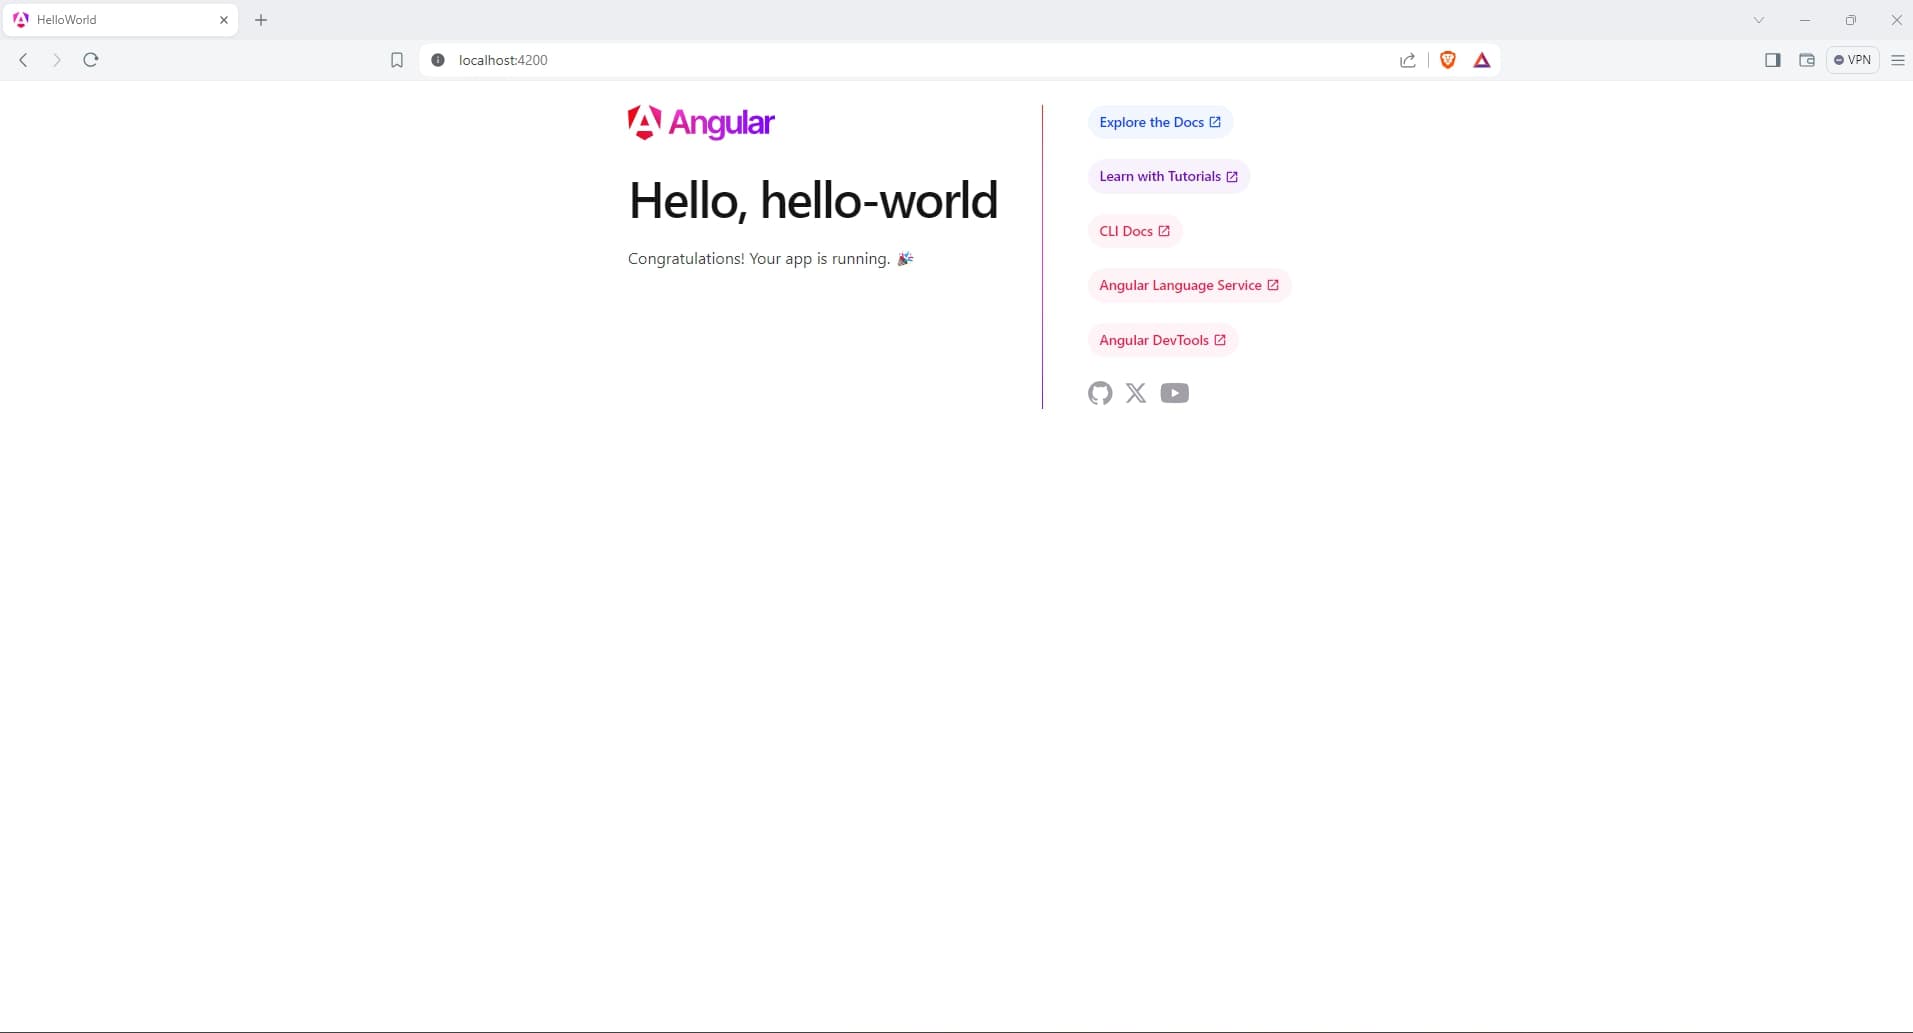
By now you will be having a basic angular application running.

Write a simple Dockerfile regarding the image
FROM node:18 as build-stage
WORKDIR /app
COPY package*.json /app/
RUN npm install
COPY ./ /app/
ARG configuration=production
RUN npm run build -- --output-path=./dist/out --configuration $configuration
and build it by using
$ docker build -t hello-world .
Once the build is complete we will proceed to write a helm chart.
$ helm create hello-world
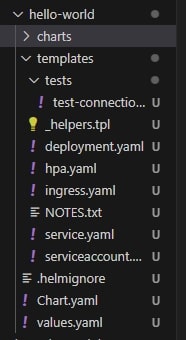
go inside the newly created hello-world directory and explore the newly genrated yaml files

Go ahead and modify the values in yaml files aacording to your needs
Once the modification is done, we can proceed to install the chart.
$ helm install hello-world ./hello-world